 This is my second post on performance tuning the OSX network stack. My previous post on this topic has gotten over 55,000 views and generated quite a bit of feedback and questions. This updated post is intended to address performance tuning the IP stack on OSX Mavericks and, hopefully, eliminate some of the confusion around many of the caveats and options, as this is a fairly complex topic. Much of this configuration and the settings are backwards compatible to previous OSX releases. However, please refer to my original post for the gory details and caveats related to previous OSX releases. You can also find my latest updates for High Sierra and Mojave in my most recent post here.
MBUF Memory Allocation
Probably the most fundamental yet debatable system option for network tuning is memory allocation to the mbuf buffer pools. This boot-time parameter governs the scalability of network connections, in terms of the simultaneous number supported and how much data can be queued in either direction. This is the basis for determining most of the buffer and socket threshold values which can impact network throughput and connection scalability. The default value seems to be set based on the amount of physical RAM your system has installed. Based on my research, BSD, the underlying OS that OS X is built on top of, defaults to assigning 64MB of memory to the mbuf pool. This memory must be fairly allocated with per socket/connection thresholds to reasonably protect you from starving the entire system with just a handful of network connections. Thus, you want to set a limit as to how much memory a single connection can consume, balanced based on peak profile usage. I have not been able to identify if OSX detects the amount of system RAM upon install and sets the built-in boot argument as part of the install script or if it is just arbitrarily defined for a particular OSX release. Anyone that has this information, feel free to share it here in the comments. I’d appreciate it.
OSX Mavericks 10.9 running on a brand new Macbook with 16Gig of RAM appears to have been configured to allocate 128MB of memory to the mbuf pool. That is double the value I see set on my Macbook running Mountain Lion 10.8 with 8Gig of RAM. I have not found a way to reveal the actual allocation value. But, what I do know is the standard way the system calculates the buffer settings and can reverse those values to arrive at the number.
There is a system setting called kern.ipc.maxsockbuf. This value sets the maximum amount of Bytes of memory that can be allocated to a single socket. The standard calculation sets this value to 1/16th of the total amount of memory allocated to the mbuf pool. In the case of my Macbook running Mavericks 10.9, that means I could have a total of 16 sockets open each with a maximum of 8MB of buffer memory assigned. That is a considerable amount of memory per socket. Typical application connections on a user machine, under normal network conditions, won’t normally use more than 128 to 256KB of buffer memory at peak utilization. So by allocating more memory to the mbuf pool, you allow the system the ability to manage more simultaneous connections with the ability to dynamically expand their buffers to improve performance as needed. This is usually more of an issue with servers because they must be built to support large numbers of simultaneous connections from many application users and potentially a mix of connections that require considerably high throughput, depending on the applications in use.
My recommendation is to let the system select the defaults for kern.ipc.maxsockbuf and kern.ipc.nmbclusters. The more physical memory your system has, the more connections and throughput per connection you will be able to obtain. If you decide you really need to raise these limits because you like to run multiple simultaneous backup jobs across your network interface or you are hosting a busy webserver or you are continuously running Torrents or you have an unhealthy obsession with seeing how far you can push your system just for fun, then you will need to add an NVRAM boot argument to do so. I would first verify if you are even running into memory exhaustion.
Use the command ‘netstat -m’ from a terminal prompt. The most important metrics are
0 requests for memory denied
0 requests for memory delayed
If you are not seeing any hits in these counters, you are not taxing your buffer memory. Otherwise, increasing your mbuf pool will provide some performance improvement or ability to support more simultaneous connections.
If you really want more memory allocated you can update your NVRAM settings with the following command:
sudo nvram boot-args=”ncl=131072″
This would allocate 256MB of memory to the mbuf pool which is the recommendation for a 10Gig interface.
For a system with 16Gig of RAM, the ncl or mbuf value appears to be set to 65536. This equals 65536 2KB clusters which equates to 131072KB or 128MB of RAM. This should be more than enough for 1Gig interfaces and below. 1/16th of that pool which is equivalent to the kern.ipc.maxsockbuf value is 8MB or 8388608 Bytes. You can confirm your own system setup by running the command ‘sudo sysctl -a | grep kern.ipc.maxsockbuf’. Multiply that value by 16 and then divide by 1024 twice to arrive at the number of MegaBytes of RAM allocated to your ncl or mbuf pool. The above NVRAM boot-arg, which is recommended to be a binary multiple to align evenly with memory cluster allocation, will assign 131072 2KB clusters to the mbuf pool. That is 262144KB = 256MB of RAM. It is up to you how much RAM you want to dedicate to your network buffers. The defaults will work just fine for 99% of the users out there on 1 Gig interfaces or lower. If you are needing to tune I would stress test your typical usage behavior and monitor the output of ‘netstat -m’ and see if you are hitting denied memory requests. If so, then try adjusting your mbuf boot-arg to double whatever you calculate your default mbuf value to be. Use the ‘sudo nvram boot-args=”mbufvalue” ‘ command (replacing mbufvalue with the number you calculate) and reboot the system and try again.
For users with 10Gig interfaces the recommendation is to assign at least 256MB of memory to the mbuf pools. This should result in a kern.ipc.maxsockbuf value of 16777216.
Base Config Recommendations
Now that I’ve pretty much made everyone’s eyes glaze over on that one fundamental setting, I’ll get on with the bulk of the configuration details. I am still researching the details on the TCP autotuning features that are now included in OSX Mavericks 10.9. At first glance, the relevant parameters appear to be automatically derived from the sendspace and recvspace values that are manually set below. I have not been able to map the specific labeled parameters on OSX Mavericks back to the BSD standard settings, yet. It is a good possibility there is nothing to be done with these settings.
For reference, here are the custom settings I have added to my own sysctl.conf file:
kern.ipc.somaxconn=2048
net.inet.tcp.rfc1323=1
net.inet.tcp.win_scale_factor=4
net.inet.tcp.sendspace=1042560
net.inet.tcp.recvspace=1042560
net.inet.tcp.mssdflt=1448
net.inet.tcp.v6mssdflt=1412
net.inet.tcp.msl=15000
net.inet.tcp.always_keepalive=0
net.inet.tcp.delayed_ack=3
net.inet.tcp.slowstart_flightsize=20
net.inet.tcp.local_slowstart_flightsize=9
net.inet.tcp.blackhole=2
net.inet.udp.blackhole=1
net.inet.icmp.icmplim=50
The easiest way to edit this file is to open a Terminal window and execute ‘sudo nano /etc/sysctl.conf’. The sudo command allows you to elevate your rights to admin. You will be prompted to enter your password if you have admin rights. nano is the name of the command line text editor program. The above entries just get added to this file one line at a time.
You can also update your running settings without rebooting by using the ‘sudo sysctl -w’ command. Just append each of the above settings one at a time after this command. kern.ipc.maxsockets and kern.ipc.nmbclusters can only be modified from the sysctl.conf file upon reboot.
Explanation of Configuration Options
Following you will find my explanations about each of the parameters I have customized or included in my sysctl.conf file:
You’ll note that I have removed the system parameters to adjust the socket buffers and nmbclusters. The defaults on a system with 16Gig of RAM are more than enough for the stuff that I do. Read above on the explanation to tune these using the actual memory allocation to the mbuf pool. Changing that one setting will automatically adjust all of the other settings accordingly without having to rely on your own math skills.
The net.inet.tcp.sockthreshold setting has also been deprecated in OSX 10.9 Mavericks. I have been looking for any documentation relating to this change and have not yet found anything useful. This setting used to be used as a sort of grooming mechanism to trigger an arbitrary socket count threshold at which the system would start obeying the values you set in the net.inet.tcp.recvspace and net.inet.tcp.sendspace parameters. With the absence of this parameter, the question is if it is no longer adjustable or if this feature has been completely removed. Anyone with info on this change, please feel free to share here.
- kern.ipc.somaxconn limits the maximum number of sockets that can be open at any one time. The default here is just 128. If an attacker can flood you with a sufficiently high number of SYN packets in a short enough period of time, all of your possible network connections will be used up, thus successfully denying your users access to the service. Increasing this value is also beneficial if you run any automated programs like P2P clients that can drain your connection pool real quickly.
- I have hard-coded the enabling of RFC1323 (net.inet.tcp.rfc1323) which is the TCP High Performance Options (Window Scaling). This should be on by default on OSX Mavericks 10.9. It has been a default setting, since at least Snow Leopard OSX 10.6, if not even earlier on Leopard OSX 10.5. It should be noted that this setting also enables TCP Timestamps by default. This adds an additional 12 bytes to the TCP header, thus reducing the MSS from 1460 to 1448 bytes. The Window scale factor, at this point, is arbitrarily set to a default of 3. I have intentionally hard-coded the Window Scaling factor to 3 because it matches my need to fill up my particular Internet connection. Ensuring this value is set to 3 allows me the ability to fully utilize my 45Meg AT&T U-verse connection. I calculated this based on my Internet connection’s bandwidth-delay product (BDP). On average I should be able to achieve 45Mbps or 45 x 106bits per second. My average maximum roundtrip latency is somewhere around 50 milliseconds or 0.05 seconds. 45 x 106 x 0.05 = 2,250,000 bits. So, my Internet connection can nominally sustain approximately 2,250,000 / 8 bits per byte = 281,250 Bytes of data in-transit on the network from Point A to Point Z. If my aim is to fully utilize my Internet bandwidth, setting a Window value that allows at a minimum double that amount in either direction would be recommended. The TCP window field in an IP packet is 16 bits wide yielding a maximum possible value of 65535 Bytes. A window scaling factor of 3 which is the same as saying a factor of 23 = 8 is more than enough to fill my Internet connection twice. If the TCP window is set to 65535 with a window scale factor of 3, I would be able to transmit 23 x 65,535 Bytes = 524,280 Bytes on the network before requiring an ACK packet. So, a value of 3 for the Window Scale Factor setting should be more than adequate for the vast majority of individual’s Internet connections at 100Mbps or less. Once you get beyond 100Mbps with an average peak latency around 50 milliseconds, you might want to consider bumping the Window Scale Factor up to 4, as I have done, since I have a Gig connection on my local network. You would also want to recalculate your BDP and determine the appropriate window size based on a Window Scale Factor of 4 or 24 = 16If you notice unacceptably poor performance with key applications you use, I would suggest you try disabling the RFC1323 option altogether and make sure your net.inet.tcp.sendspace and net.inet.tcp.recvspace values are set to exactly 65535. Any applications that have load balanced servers with Window scaling enabled and are using a Layer 5 type load balancing ruleset (e.g.load balance based on URL or object type) can exhibit severe throughput problems if the explicit window scaling configuration has not been properly addressed on the Load Balancer. This is another fairly complex issue with how load balancers manage TCP connections with Layer 5 rules and how Window Scaling is negotiated during the TCP setup handshake. When not configured properly, you will end up with the 2 endpoints in a transaction that do not use the same Window Scaling factor or one end is Window Scaling and the other is not.
- The net.inet.tcp.sendspace and net.inet.tcp.recvspace settings control the maximum TCP window size the system will allow sending from the machine or receiving to the machine. Up until the latest releases of most operating systems, these values defaulted to 65535 Bytes. This has been the de facto standard essentially from the beginning of the TCP protocol’s existence in the 1970’s. Now that the RFC1323 High Performance TCP Options are starting to be more widely accepted and configured, these values can be increased to improve performance. I have set mine both to 1042560 bytes. That is almost a factor of 16 times the old default 65535 limit. I arrived at this value using the following calculation: MSS x (16bit Window/MSS) x (Window Scale Factor) = 1448 x 45 x 24 = 1042560. If I wanted to keep it an even multiple of the maximum TCP Window field width of 16bits or 65535, I could round up to 16 x 65535 = 1048560 Bytes. There is no hard and fast rule on that. Generally, the most optimal setting would be to use the calculated value based on your own network’s BDP. You may want to factor in the worst case scenario between your Internet connection and your local LAN connection. In my case, I have opted to use the numbers for my local Gig connection. TCP autotuning should take care of my Internet connection. In the case of my Internet connection, if I doubled my current 45Mbps bandwidth and the average latency factor stayed the same, I would want to double my TCP window size to be able to utilize my full bandwidth.Following is how I arrived at these numbers:
- The MSS I am using is 1448 because I have RFC1323 enabled which enables TCP Timestamps and reduces the default MSS of 1460 bytes by 12 bytes to 1448 bytes.
- 24 matches the Windows Scaling Factor I have chosen to configure.
- The value of 45 is a little bit more convoluted to figure out. This number is a multiple of the MSS that is less than or equal to the max TCP Window 16bit field value of 65535 bytes. So, 1448 x 45 = 65160. If you were using an MSS of 1460, this value would be set to 44. But, in the case of OSX, since TCP Timestamps are automatically enabled when you enable RFC1323, you shouldn’t set the MSS higher than 1448. It might be less if you have additional overhead on your line such as PPPoE on a DSL line etc.
You must have the RFC1323 options enabled, in order to set these values above 65535.
- The net.inet.tcp.mssdflt setting seems simple to configure on the surface. However, arriving at the optimum setting for your particular network setup and requirements can be a mathematical exercise that is not straightforward. The default MSS value that Apple has configured is a measly 512 bytes. That setting value is really targeted to be optimal for dial-up users or users with fairly slow broadband connections ~3Mbps and below. The impact is not really noticeable on a high speed LAN segment. But it can be a performance bottleneck across a typical residential broadband connection with higher latency. This setting adjusts the Maximum Segment Size that your system can transmit. You need to understand the characteristics of your own network connection, in order to determine the appropriate value. For a machine that only communicates with other hosts across a normal Ethernet network, the answer is very simple. The value should be set to 1460 bytes, as this is the standard MSS on Ethernet networks. IP packets have a standard 40 byte header. With a standard Maximum Transmission Unit (MTU) of 1500 bytes on Ethernet, that would leave 1460 bytes for payload in the IP packet. In my case, I had a DSL line that used PPPoE for its transport protocol. In order to get the most out of that DSL line and avoid wasteful protocol overhead, I wanted this value to be exactly equal to the amount of payload data I could attach within a single PPPoE frame to avoid fragmenting segments which causes additional PPPoE frames and ATM Cells to be created which adds to the overall overhead on my DSL line and reduces my effective bandwidth. There are quite a few references out there to help you determine the appropriate setting. So, to configure for a DSL line that uses PPPoE like mine, an appropriate MSS value would be 1452 bytes. 1460 bytes is the normal MSS on Ethernet for IP traffic, as I described earlier. With PPPoE you have to subtract an additional 8 bytes of overhead for the PPPoE header. That leaves you with an MSS of 1452 bytes. There is one other element to account for. ATM. Many DSL providers, like mine, use the ATM protocol as the underlying transport carrier for your PPPoE data. That used to be the only way it was done. ATM uses 53 byte cells of which each cell has a 5 byte header. That leaves 48 bytes for payload in each cell. If I set my MSS to 1452 bytes, that does not divide evenly across ATM’s 48 byte cell payloads. 1452/48 = 30.25 I am left with 12 bytes of additional data to send at the end. Ultimately ATM will fill the last cell with 36 bytes of null data in that scenario. To avoid this overhead, I reduce the MSS to 1440 bytes so that it will evenly fit into the ATM cells. 30 * 48 = 1440 < 1452.I now have AT&T U-verse which uses VDSL2+ with Packet Transfer Mode (PTM) as the underlying transport protocol. It provides a native MTU of 1500 Bytes. So this eliminates all the complexity of the above calculations and takes things back to the default of 1460 bytes. However, if you have enabled the RFC1323 option for TCP Window Scaling, the MSS should be set to 1448 to account for the 12 byte TCP Timestamp headers that OSX includes when that option is enabled.
- The setting net.inet.tcp.v6mssdflt adjusts the default MSS for IPv6 packets. A large majority of users do not have IPv6 access yet, so this setting is not important at this point. If you are an AT&T U-verse customer and you don’t have IPv6 yet, you will very soon and probably not even know it. With AT&T, my IPv6 connectivity is not delivered natively. AT&T uses what is called a 6rd tunnel from the customer’s residential gateway (modem) to their Border Relay router to provide IPv6 access. AT&T sets the MTU on the 6rd tunnel at 1472 Bytes. So, the IPv6 MSS must be calculated starting from this point. The standard IPv6 header is 40 Bytes. The TCP header is 20 Bytes. An MTU of 1472 Bytes minus 60 Bytes of IPv6 overhead leaves us with an IPv6 MSS of 1412 Bytes. This config will depend on your IPv6 setup and whether you have native IPv6 access or are using one of the wide variety of tunnel or translational mechanisms to gain access to the IPv6 Internet.When running 6rd tunneling for IPv6 access, the best practice, if possible, is minimally to configure the IPv6 MTU to 1480 on the router Ethernet interfaces connected to the network segments with IPv6 clients. In the case of AT&T I have to set it to 1472. The IPv6 Router Advertisement (RA) message sent from the router to the local segments will advertise this non-standard MTU to all the attached devices. They will automatically derive their default MSS as 1472 Bytes MTU – 40 Bytes IPv6 header – 20 Bytes of TCP header = 1412 Bytes. The good news is that IPv6 is pretty efficient at doing Path MTU Discovery and adjusting its own MSS on the fly. This configuration setting provides the best chance for no packet fragmentation without discovery delay.For your reference, I found the following note related to IPv6 performance on BSD which is the underlying OS for Mac OSX: Testing has shown that on end-to-end 10G paths, IPV6 appears to be about 40% slower than IPV4 on FreeBSD 7.3, and 20% slower on FreeBSD 8.2. This is a known FreeBSD issue, and will be addressed in a future release.
- net.inet.tcp.msl defines the Maximum Segment Life. This is the maximum amount of time to wait for a TCP ACK in reply to a TCP SYN-ACK or FIN-ACK, in milliseconds. If an ACK is not received in this time, the segment can be considered “lost” and the network connection is freed. This setting is primarily about DoS protection but it is also important when it comes to TCP sequence reuse or Twrap. There are two implications for this. When you are trying to close a connection, if the final ACK is lost or delayed, the socket will still close, and more quickly. However if a client is trying to open a connection to you and their ACK is delayed more than 7500ms, the connection will not form. RFC 753 defines the MSL as 120 seconds (120000ms), however this was written in 1979 and timing issues have changed slightly since then. Today, FreeBSD’s default is 30000ms. This is sufficient for most conditions, but for stronger DoS protection you will want to lower this. I have set mine to 15000 or 15 seconds. This will work best for speeds up to 1Gbps. See Section 1.2 on TCP Reliability starting on Page 4 of RFC1323 for a good description of the importance of TCP MSL as it relates to link bandwidth and TCP sequence reuse or Twrap. If you are using Gig links, you should set this value shorter than 17 seconds or 17000 milliseconds to prevent TCP sequence reuse issues.Most IP stack implementations that are RFC1323 compliant now include TCP Timestamps and the (PAWS) Protection Against Wrapped Sequence numbers mechanism to counteract the Twrap problem with a lengthy MSL on a high speed link. This reduces the MSL feature to only be relevant to the length of time a system will permit a segment to live on the network without an ACK. It is probably still a good idea to keep this value fairly low with the higher bandwidth and lower latency connections of today.
- net.inet.tcp.delayed_ack controls the behavior when sending TCP acknowledgements. Allowing delayed ACKs can cause pauses at the tail end of data transfers and used to be a known problem for Macs. This was due to a known poor interaction with the Nagle algorithm in the TCP stack when dealing with slow start and congestion control. I previously had recommended disabling this feature completely by setting it to “0”. I have since learned that Apple has updated the behavior of Delayed ACK to resolve this problem. Since the release of OSX 10.5 Leopard, Apple integrated support for Greg Minshall’s “Proposed Modification to Nagle’s Algorithm” into the Delayed ACK feature. This fixes the problem for 10/100/1000 Meg interfaces. I have now reverted this setting back to the default and enabled this feature in auto-detect mode by setting the value to “3”. This effectively enables the Nagle algorithm but prevents the unacknowledged runt packet problem causing an ACK deadlock which can unnecessarily pause transfers and cause significant delays.Update: As Florian has indicated in the comments below, on interfaces above 1Gig (e.g. 10Gig), it appears that the delayed_ack feature presents performance issues once again. The large majority of users will not be impacted by this behavior on 100Meg or 1Gig interfaces. Hopefully I will be able to find some further reference information on this to post here. So, for now, if you are using a 10Gig interface you will want to disable this feature.For your reference, following are the available options:
- delayed_ack=0 responds after every packet (OFF)
- delayed_ack=1 always employs delayed ack, 6 packets can get 1 ack
- delayed_ack=2 immediate ack after 2nd packet, 2 packets per ack (Compatibility Mode)
- delayed_ack=3 should auto detect when to employ delayed ack, 4 packets per ack. (DEFAULT recommended)
- net.inet.tcp.slowstart_flightsize sets the number of outstanding packets permitted with non-local systems during the slowstart phase of TCP ramp up. In order to more quickly overcome TCP slowstart, I have bumped this up to a value of 20. This allows my system to use up to 10% of my bandwidth during TCP ramp up. I calculated this by figuring my Bandwidth-Delay Product and taking 10% of that value divided by the max MSS of 1448 bytes to get rough packet count. So, taking the line rate at 45Mbps or 45 x 106 x 50 milliseconds or 0.05 seconds / 8 bits per byte / 1448 bytes per packet x 10%, I came up with roughly 20 packets.
- net.inet.tcp.local_slowstart_flightsize is the same as above but only applies to connections on the local network. Typically you can be liberal and set this to be less restrictive than the above setting. However, locally you usually have higher bandwidth @ 100Mbps or 1Gbps and lower latency at ~1 msec or less. If I followed the same formula as above, I’d come up with less than 1 packet on a 100Mbps connection with ~1 msec of latency. In my case, I have a 1Gig connection. AT 10% that works out to 8.6 packets so I rounded it up to 9 packets.
- net.inet.tcp.blackhole defines what happens when a TCP packet is received on a closed port. When set to ‘1’, SYN packets arriving on a closed port will be dropped without a RST packet being sent back. When set to ‘2’, all packets arriving on a closed port are dropped without an RST being sent back. This saves both CPU time because packets don’t need to be processed as much, and outbound bandwidth as packets are not sent out.
- net.inet.udp.blackhole is similar to net.inet.tcp.blackhole in its function. As the UDP protocol does not have states like TCP, there is only a need for one choice when it comes to dropping UDP packets. When net.inet.udp.blackhole is set to ‘1’, all UDP packets arriving on a closed port will be dropped.
- The name ‘net.inet.icmp.icmplim‘ is somewhat misleading. This sysctl controls the maximum number of ICMP “Unreachable” and also TCP RST packets that will be sent back every second. It helps curb the effects of attacks which generate a lot of reply packets. I have set mine to a value of 50.
References
- Mac Geekery’s Network Tuning Guide – (offline) Archive link
- TCP Tuning Guide for FreeBSD
- TCP Performance problems caused by interaction between Nagle’s Algorithm and Delayed ACK
- Wikipedia.org – Bandwidth-Delay Product
- IETF RFC1323 – TCP Extensions for High Performance
- Adjusting network buffer memory on OSX
- Explanation of socket buffer memory allocation
- OSX Boot-time kernel arguments
- Detailed explanation of the BSD Initialization process of the Mac OSX kernel


Excellent!
LikeLike
By: mark on May 17, 2014
at 4:08 pm
Very interesting insights!
I was searching for information about transfer speed issues with AFP File sharing. I am currently on Mojave 10.14.4
The interesting thing is that I was experiencing significant differences in transfer speed performance between 2 AFP connection methods:
1) Finder(Sidepanel): Locations
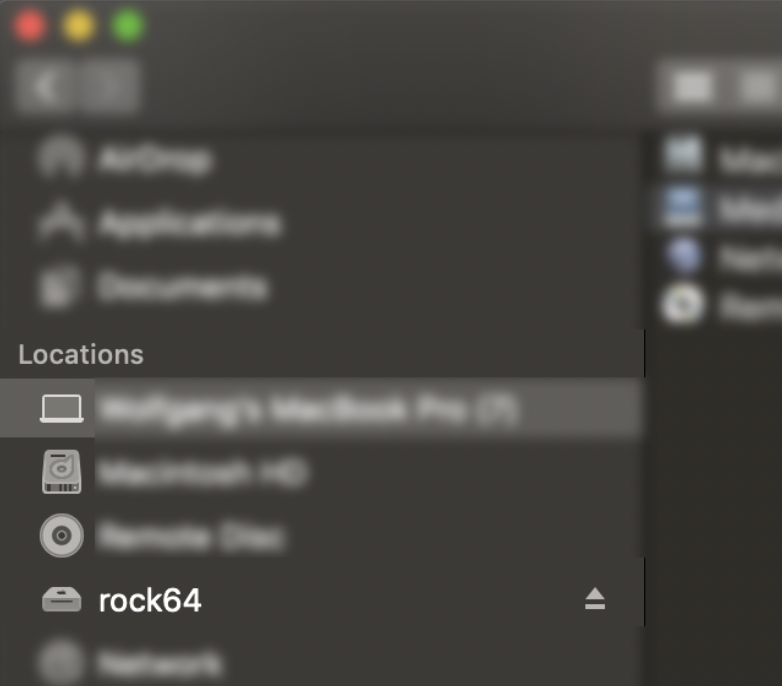
This was my get go connection because it connects to ALL the shared folders on the AFP server.
Transfer Speed (via WiFi and Gbit Ethernet in LAN):
small files (300 MB) @ ~50 MB/s
1 GB files @ ~20 MB/s
5+ GB files @ ~10 MB/s
2) Finder > Go > Connect to Server… (CMD + K)
afp://192.168.0.64
Transfer Speed (in LAN):
~65 MB/s (via Gbit Ethernet)
~36 MB/s (via WiFi)
Even stranger:
My brother has the same NAS setup (rock64 single board computer, Debian GNU/Linux 9.9 (stretch), Openmediavault) with AFP shares. With his mac on Mojave he gets > 80 MB/s constantly.
Regardless of the AFP connection method.
I would love to find out what causes these differences and how to adjust my setup to make it work better.
My machine —– my brother’s machine:
MacBook Pro (15-inch, 2018) —– Mac mini (Late 2014)
2,6 GHz Intel Core i7 —– 2,6 GHz Intel Core i5
16 GB 2400 MHz DDR4 —– 8 GB 1600 MHz DDR3
Radeon Pro 560X 4 GB (built in: Intel UHD Graphics 630) —– Intel Iris 1536 MB
LikeLike
By: LEITWOLFfilm on May 2, 2019
at 3:48 am
[…] There is a decent amount of documentation out there that details all of the tunable parameters on the Mac OSX IP stack. However, most of these documents either provide basic suggestions without much background on a particular setting or they discuss some of the implications of changing certain parameters but don’t give you very solid guidance or recommendations on the best configuration in a particular scenario. Many of the parameters are dependent upon others. So, the configuration should be addressed with that in mind. This document applies to OSX 10.5 Leopard, 10.6 Snow Leopard, 10.7 Lion, and 10.8 Mountain Lion. Updates for 10.9 Mavericks are mostly minor. Here is a link to my latest post on performance tuning the network stack on OSX Mavericks 10.9. […]
LikeLiked by 1 person
By: Performance Tuning the Network Stack on Mac OS X | Rolande's Ramblings on May 18, 2014
at 10:37 am
Hi Rolande,
I’m in the field of broadcast video storage systems. We do a lot of high performance, low latency NAS based storage installations. Based on my experience the Nagle Algorithm in OS X is only fixed for 1Gbit networks. For example we had a client with six machines all doing AFP over 10Gbit Ethernet and we had big performance troubles about every two days. After disabling delayed_ack it’s working flawlessly!
My question is: Where did you get the informantion from that it’s fixed and is there any documentation available?
LikeLike
By: Florian on May 19, 2014
at 2:24 am
Hey Florian. It is great to hear use cases like yours that really push the upper limits of the technology. Obviously the vast majority of end users are not installing 10 Gig interfaces on their Macbooks or workstations. 😉 Look at the bottom of this post for the References section and you will see the 3rd link is the one that has all of the info related to the fix.
It is possible that there is an interaction problem between the Delayed_ACK setting and another option like net.inet.tcp.msl. Are you sure you dialed down your MSL enough on 10Gig to prevent the TCP sequence wrap issue?
LikeLike
By: rolande on May 19, 2014
at 7:57 am
Hi Rolande,
Yep you are right – not everyone is doing realtime video editing 😉 Furthermore I’m not really sure what MSL we used…. However as far as I understand it’s only relevant if you have some kind of package lost in your network. This was no issue there! Anyway, thanks for taking the time to write down all this tipps and tricks! I will dig into your references over the coming days.
LikeLike
By: Florian on May 19, 2014
at 8:05 am
The MSL is not just about lost packets. It also affects the rate at which TCP sequence numbers can be reused. If you exhaust the sequence range in less than the MSL time, it breaks duplicate ACK detection. So, I just did a quick search. I think I learn something new every day. This issue was fixed in RFC1323 with a new feature called PAWS Protection Against Wrapped Sequence numbers. It uses high order bits similar to the Window Scale Factor as a multiple factor of the Sequence field. Here is the link to the Cisco Press Storage Networking reference I found.
http://books.google.com/books?id=t6JNLceD8Y8C&pg=PT289&lpg=PT289&dq=Twrap+MSL+problem&source=bl&ots=mu3vPvrrQG&sig=zHWOD0auFcmy4-kE0kQCDabwGlI&hl=en&sa=X&ei=5wJ6U4b-DMeOqgasooLYDQ&ved=0CDEQ6AEwAQ#v=onepage&q=Twrap%20MSL%20problem&f=false
LikeLike
By: rolande on May 19, 2014
at 8:19 am
Yeah, you will definitely want to custom tune your Window Scale factor and sendspace and recvspace buffers, as well as probably adjust your NVRAM boot-args for your mbuf pool. The odds are good you will need more memory dedicated to your network stack than the typical desktop defaults, especially with a 10Gig interface. My recommendations here are aimed at the typical home broadband user and not a video editing power user on a 10Gig LAN/NAS-Storage segment.
LikeLike
By: rolande on May 19, 2014
at 10:15 am
great read, thanks for the detail
LikeLike
By: Andrej Hribernik (@andrejhrib) on May 19, 2014
at 7:24 am
Scott,
Read somewhere that the following improves our networking:
net.inet.tcp.autorcvbufmax=3145728
net.inet.tcp.autosndbufmax=3145728
net.inet.tcp.autorcvbufinc=81920
net.inet.tcp.autosndbufinc=81920
So I don’t see any difference so far. Any thoughts?
LikeLike
By: mark on May 26, 2014
at 3:24 pm
I haven’t found any good reference yet on TCP autotuning on BSD or OSX. The first 2 options just allow a larger buffer value per connection than the default allocations when necessary. You would need to be moving a serious amount of data to fill that. You would also need to allow a window scale factor of at least 6 to be able to negotiate a window large enough to potentially even fill that.
I have not found a good explanation of the other 2 “inc” parameters. Not sure if that is an absolute value of 2KB mbuf clusters it can increase per flow above the max or what it is or how it relates to the first two parameters.
You would have to really be stressing your connection above 1 Gig speeds I think to make use of that. That’s probably why you don’t notice a difference.
LikeLike
By: rolande on May 26, 2014
at 4:02 pm
Hello Rolande… thanx for your extremely helpful post. I am a bit confused as to how the parameters work together. My scenario is that I have a reasonable bandwidth (20MB down, 5 Up) but terrible latency (950ms) satellite link. We have internet in a geographical location where that is the only option. When browsing to SSL sites, I am getting a lot of connection resets, because the SSL acknowledgements are coming back too slow. How can I increase the wait time without shooting myself in the foot? (OSX Mavericks) unlike most of your readers, I am not trying to improve the performance and utilization of good links… trying to make bad ones work at all 🙂
Any advice greatly appreciated….
LikeLike
By: Robert Altinger on July 12, 2014
at 1:19 pm
The point with adjusting the TCP settings is that the more bandwidth you have and the higher the average latency, the more outstanding (i.e. unacknowledged) data you can have on the network. That is great for large data transfers but doesn’t do a thing for transaction that require back and forth negotiation like SSL/TLS. Wow! 950 milliseconds is crazy latency. Is that round-trip or one-way? Sorry to hear you are stuck with such poor latency.
The fact that your HTTP connections work okay and just SSL connections are having the issue, leads me to believe that it is not necessarily a TCP problem. The issue is that SSL itself is timing out on the handshake process of certificate validation, key negotiation, and cipher negotiation or at every key re-negotation interval which can typically happen every 2 minutes. Is it all SSL sites that you experience this problem with or just some? Does it happen right away on the initial request or is it further into an established session that you see the behavior? One thought is that you may want to disable OCSP certificate validation if you have that enabled. That is one more added delay to the process.
If you are really experiencing 950 msecs delay one way, that adds nearly 2 seconds for every request response exchange that must occur during the handshake. There are a minimum of 3 exchanges that must occur during SSL negotiation with multiple packets in both directions. The client and/or the server may induce additional wait time depending on how it is programmed.
The other problem with SSL is that it can perform a re-negotiation at any time during a session. Then you have to go through the entire process again. It could be that the sites you are connecting to that display this problem behavior are tuned more aggressively to renegotiate session keys frequently and you see failure in the process due to the long latency and potentially any packet loss that might occur. The higher the latency, the more devastating any single dropped packet can be to a connection just due to the way the timers work.
Unfortunately for real-time exchanges like SSL negotiation, there is not much you can really do on the TCP stack to make it better. It is what it is. The only thing I can think of is to tune any SSL settings in the browser to make it is lightweight as possible from a negotiation standpoint. e.g. Disable certificate validation
Another thought I had was to enable HTTP pipelining for SSL in your browser, if possible. This allows for many parallel object requests per TCP connection instead of waiting for each object request to complete before requesting the next one. On a page with more than just a few objects (which is pretty much 99% of all content out there), it might help, although this article (http://www.guypo.com/technical/http-pipelining-not-so-fast-nor-slow/) seems to contradict the value of pipelining. The number of parallel TCP connections your browser supports seems to be the most effective way to increase page load times. Most browsers default to 4 or 6 connections. If you can increase this value to maybe 10 to 12, you may see a significant improvement in page load times, too. Be careful with how high you crank the simultaneous connection counts. Some sites may have limits per client and slow you down or block you if they detect what they consider to be abuse.
LikeLike
By: rolande on July 12, 2014
at 2:09 pm
Scott, do u have similar settings for other IOS devices, such as iphone & ipad?
LikeLike
By: Mark on July 23, 2014
at 7:05 pm
Mark, you can not tune the settings on iOS devices. Those devices are locked down. It might be possible if they are jail broken but I have never done that and don’t plan to. Typically the default settings are fine for normal data transfer. I haven’t seen any use cases for large data transfers on iPhones or iPads where it might make a difference.
LikeLike
By: rolande on July 23, 2014
at 8:33 pm
Scott u may want to try yosemite. I made some changes in the sysctl, the system just wont consider it. Though I don’t have any problem in speed
LikeLike
By: Mark on July 25, 2014
at 7:23 pm
It’s possible that they have expanded or improved the autotuning in the stack to the point that many of the parameters can no longer be configured statically. That could actually be a good thing.
LikeLike
By: rolande on July 25, 2014
at 10:11 pm
Anyone who tried this in Yosemite?
Customs settings improve the performance but it isn’t constant
LikeLike
By: Pablo on November 4, 2014
at 3:43 am
Under Yosemite, seeing complete network stack lockup under heavy load testing (http server): “131754 KB allocated to network (100.0% in use)”
After 20-30 seconds, whatever pathological condition is happening resolves, and function returns, but this behavior repeats. But some connections are delayed by 8/30/dropped.
Newbie question: there is no sysctl.conf
LikeLike
By: Lloyd Chambers on January 4, 2015
at 11:46 am
When the hang occurs, looks like this:
24615/24615 mbufs in use:
24565 mbufs allocated to data
50 mbufs allocated to socket names and addresses
712/712 mbuf 2KB clusters in use
19884/19884 mbuf 4KB clusters in use
2730/2730 mbuf 16KB clusters in use
131754 KB allocated to network (99.8% in use)
0 KB returned to the system
0 requests for memory denied
1038 requests for memory delayed
226 calls to drain routines
LikeLike
By: Lloyd Chambers on January 4, 2015
at 12:29 pm
(sorry, forgot to do in one post). And when the hang resolves 20-30 seconds later, like this:
746/19861 mbufs in use:
696 mbufs allocated to data
50 mbufs allocated to socket names and addresses
19115 mbufs allocated to caches
512/1170 mbuf 2KB clusters in use
0/19648 mbuf 4KB clusters in use
0/2730 mbuf 16KB clusters in use
131754 KB allocated to network (1.4% in use)
0 KB returned to the system
0 requests for memory denied
1070 requests for memory delayed
241 calls to drain routines
There is no CPU usage and no network activity during the hang; attempts to use a web browser also hang.
LikeLike
By: Lloyd Chambers on January 4, 2015
at 12:30 pm
Additional notes:
– isolating to two machines in cisco gigabit switch (no other network connectivity), client hitting server with 32 threads, same problem.
– occurs on 8 core Mac Pro, 2 core MacBook Pro, 4 core MacBook Pro, all as servers, so it’s not machine dependent.
– occurs on OS X 10.8 and 10.10.1, so it’s not OS version dependent
– very high connection rate (several thousand per second), each delivering typical 4K to 40K html files
LikeLike
By: Lloyd Chambers on January 4, 2015
at 1:10 pm
Just before the lockup:
diglloydTest:DIGLLOYD lloyd$ netstat -mm
class buf active ctotal total cache cached uncached memory
name size bufs bufs bufs state bufs bufs usage
———- —– ——– ——– ——– —– ——– ——– ———
mbuf 256 26246 4511 27136 purge 0 890 1.1 MB
cl 2048 5569 403 5972 purge 0 403 806.0 KB
bigcl 4096 17056 110 17166 purge 0 110 440.0 KB
16kcl 16384 2730 0 2730 on 0 0 0
mbuf_cl 2304 5569 5569 5569 purge 0 0 12.2 MB
mbuf_bigcl 4352 17056 17056 17056 purge 0 0 70.8 MB
mbuf_16kcl 16640 1744 2730 2730 on 986 0 43.3 MB
25260/26246 mbufs in use:
25257 mbufs allocated to data
3 mbufs allocated to packet headers
986 mbufs allocated to caches
5569/5972 mbuf 2KB clusters in use
17056/17166 mbuf 4KB clusters in use
1744/2730 mbuf 16KB clusters in use
131754 KB allocated to network (86.7% in use)
0 KB returned to the system
0 requests for memory denied
34 requests for memory delayed
14 calls to drain routines
LikeLike
By: Lloyd Chambers on January 4, 2015
at 1:55 pm
I just upgraded my 2009 Macbook Pro with 8GB SDRAM to Yosemite about a week ago. I’ve noticed slowness but haven’t had any time to look at it. I just did a netstat -m. Something is definitely messed up. I am not doing anything active on the network. I have Gmail and Google Drive open and a LastPass plugin running which all generate connections but mostly sit idle. It is allocating resources based on connection/socket counts but the resource counts just look entirely wrong. Only 3087 mbufs available? That is totally wrong. It should be 131072. Definitely going to look into what is going on here.
426/3087 mbufs in use:
426 mbufs allocated to data
2661 mbufs allocated to caches
257/2974 mbuf 2KB clusters in use
0/747 mbuf 4KB clusters in use
0/8 mbuf 16KB clusters in use
10628 KB allocated to network (5.8% in use)
0 KB returned to the system
0 requests for memory denied
0 requests for memory delayed
0 calls to drain routines
LikeLike
By: rolande on January 4, 2015
at 2:08 pm
Rolande: this confused me too: mbufs start very low. The system *dynamically* adds more buffers up to the ‘ncl’ figurte, which is taken as a *maximum* (not a starting point).
LikeLike
By: Lloyd Chambers on January 4, 2015
at 3:10 pm
ANSWER: here’s what I found on OS X 10.10.1 Yosemite.
1) watch out for curly quotes in the blog (do not copy/paste!). Straight quotes required as in:
sudo nvram boot-args=”ncl=262144″
2) ncl is a *maximum*. The system allocates more memory as needed. I was confused by seeing very low memory, thinking that the boot-args settings was broken.
3) There is a pathological behavior in the OS X networking stack when memory buffers run out (at 131072 I was seeing 100% usage using 16 client threads against my highly optimized Tomcat server). When this happens a 30-second hangs until the networking stack recovers (estimate, I did not time it); it kills many connections as well as all other networking on the system.
4) with ncl=262144 I can hit about 80MB/sec on gigabit ethernet to my server and this hits about 91% utilization:
diglloydTest:DIGLLOYD lloyd$ netstat -mm
class buf active ctotal total cache cached uncached memory
name size bufs bufs bufs state bufs bufs usage
———- —– ——– ——– ——– —– ——– ——– ———
mbuf 256 35640 14366 39072 on 2210 1222 3.5 MB
cl 2048 11127 359 11486 on 0 359 718.0 KB
bigcl 4096 13579 5635 19214 on 0 5635 22.0 MB
16kcl 16384 10922 0 10922 on 0 0 0
mbuf_cl 2304 10860 11127 11127 on 267 0 24.4 MB
mbuf_bigcl 4352 13316 13579 13579 on 263 0 56.4 MB
mbuf_16kcl 16640 10922 10922 10922 on 0 0 173.3 MB
35110/35640 mbufs in use:
35101 mbufs allocated to data
9 mbufs allocated to packet headers
530 mbufs allocated to caches
10860/11486 mbuf 2KB clusters in use
13316/19214 mbuf 4KB clusters in use
10922/10922 mbuf 16KB clusters in use
287078 KB allocated to network (91.0% in use) <=========
0 KB returned to the system
0 requests for memory denied
0 requests for memory delayed
0 calls to drain routines
LikeLike
By: Lloyd Chambers on January 4, 2015
at 3:09 pm
Interesting. I just got a new NAS running a 2 x 1Gig copper Etherchannel on it and was moving large amounts of data over. I think I peaked around 500Mbps from my Macbook Pro which is connected via 1Gig copper. I didn’t think to look at mbuf usage while I was doing that. Definitely going to have to test it out now. Thanks for the info.
LikeLike
By: rolande on January 4, 2015
at 3:21 pm
500 Mbps is underperforming. I see up to ~110 MB/sec on my gigabit. But that presumes a fast SSD to send/receive (eg to read/write data)
LikeLike
By: Lloyd Chambers on January 4, 2015
at 3:32 pm
Yes. I thought the same thing. My NAS I/O can handle over 400MB/s read/write. Striped RAID5 using Western Digital 4TB Red NAS 5400RPM drives. Not SSD but they are fast enough for me. I should be able to push 800-900Mbps. My Cisco switch is non-blocking at 24 ports of 1Gig copper.
LikeLike
By: rolande on January 4, 2015
at 3:38 pm
Another note: attempting to use “ncl=393216″ (384K) hoses the networking stack. 256K might be the limit (ncl=”262144”).
LikeLike
By: Lloyd Chambers on January 4, 2015
at 3:30 pm
With ncl=262144 and 48 client threads over local gigabit LAN, I can still saturate the buffer with 99.6% utilization. Seems to behave *MUCH* better with ncl=262144 under heavy loads (no hangs). But it points out a serious weakness in the stack: more load and it would no doubt enter its sudden AWOL fit.
netstat -mm
class buf active ctotal total cache cached uncached memory
name size bufs bufs bufs state bufs bufs usage
———- —– ——– ——– ——– —– ——– ——– ———
mbuf 256 83190 14688 86000 on 345 2465 3.6 MB
cl 2048 19213 609 19822 purge 0 609 1.2 MB
bigcl 4096 52099 0 52099 purge 0 0 0
16kcl 16384 10922 0 10922 on 0 0 0
mbuf_cl 2304 19213 19213 19213 purge 0 0 42.2 MB
mbuf_bigcl 4352 52099 52099 52099 purge 0 0 216.2 MB
mbuf_16kcl 16640 10922 10922 10922 on 0 0 173.3 MB
17654/83190 mbufs in use:
17307 mbufs allocated to data
347 mbufs allocated to packet headers
65536 mbufs allocated to caches
19213/19822 mbuf 2KB clusters in use
52099/52099 mbuf 4KB clusters in use
10922/10922 mbuf 16KB clusters in use
447022 KB allocated to network (99.6% in use)
0 KB returned to the system
0 requests for memory denied
0 requests for memory delayed
4 calls to drain routines
LikeLike
By: Lloyd Chambers on January 4, 2015
at 3:42 pm
So, I ran a test earlier on my Mac mini running 10.10.1. It is connected via 1Gig copper to the same switch as my NAS box that is 2 x 1Gig copper Etherchannel. I had to move about 28GB of raw image files for archive. The throughput results peaked around 800Mbps according to my iStat monitor. It probably averaged around 500-700Mbps when it was not waiting to load up the next folder of files. Below is netstat -m outputs all during that transfer. The peak memory usage I saw was right at 19.3% of 17280KB allocated. For a simple file copy operation over AFP, I thought it performed fairly well. I think you are pushing it with 48 simultaneous client threads on an OS that was never meant/built for scalable server functionality.
$ netstat -m
2512/4491 mbufs in use:
2018 mbufs allocated to data
421 mbufs allocated to packet headers
67 mbufs allocated to socket names and addresses
6 mbufs allocated to packet tags
1979 mbufs allocated to caches
990/2780 mbuf 2KB clusters in use
0/1656 mbuf 4KB clusters in use
0/217 mbuf 16KB clusters in use
17280 KB allocated to network (15.3% in use)
0 KB returned to the system
0 requests for memory denied
0 requests for memory delayed
0 calls to drain routines
$ netstat -m
1184/3332 mbufs in use:
1110 mbufs allocated to data
1 mbufs allocated to packet headers
67 mbufs allocated to socket names and addresses
6 mbufs allocated to packet tags
2148 mbufs allocated to caches
511/2780 mbuf 2KB clusters in use
0/1656 mbuf 4KB clusters in use
0/217 mbuf 16KB clusters in use
17280 KB allocated to network (7.8% in use)
0 KB returned to the system
0 requests for memory denied
0 requests for memory delayed
0 calls to drain routines
$ netstat -m
1172/3320 mbufs in use:
1100 mbufs allocated to data
67 mbufs allocated to socket names and addresses
5 mbufs allocated to packet tags
2148 mbufs allocated to caches
511/2780 mbuf 2KB clusters in use
0/1656 mbuf 4KB clusters in use
0/217 mbuf 16KB clusters in use
17280 KB allocated to network (7.8% in use)
0 KB returned to the system
0 requests for memory denied
0 requests for memory delayed
0 calls to drain routines
LikeLike
By: rolande on January 5, 2015
at 4:15 pm
One wonders if Thunderbolt networking has any hope in h*ll of working properly (10 gigabit) with high request volumes, given that 99.6% utilization is seen using 512MB of memory buffering (ncl=262144) with gigabit.
LikeLiked by 1 person
By: Lloyd Chambers on January 4, 2015
at 3:56 pm
Hi Scott, I applied your base config recommendations to my sysctl.conf file. Could you tell me how to return everything to default values?
LikeLike
By: joe on January 31, 2015
at 7:34 am
Remove all the contents from your sysctl.conf file and reboot. Any time you change system settings from defaults on anything, if you aren’t sure what you are doing, you should take a snapshot of the default setting and archive it so you can easily back it out manually if you had to. Are you on Yosemite and did you see a performance issue?
LikeLike
By: rolande on January 31, 2015
at 10:03 am
The thing is, I cannot locate the sysctl.conf file by any tool, I edited it in terminal, but it doesn’t seem to be exist in /private/etc or in any etc folder. I set some values to default in Cocktail, but Kernel socket buffer seems to go back to 8388608 at every reboot. So why I don’t have sysctl.conf, and yet terminal can edit it?
I’m on Mavericks, and after applying the values, youtube 1080p buffering got noticeably slower, yet my primal aim was to speed that up.
LikeLike
By: joe on January 31, 2015
at 11:40 am
Are you sure that you used sudo to edit and save the file as /etc/sysctl.conf ? It won’t save in the /etc folder without sudo admin rights.
LikeLike
By: rolande on January 31, 2015
at 11:46 am
I used sudo sysctl -w and appended every command you listed in the base config recommendations.
LikeLike
By: joe on January 31, 2015
at 11:50 am
Using that command only writes to running memory. Just reboot and it will go back to defaults. You never created the text file /etc/sysctl.conf so that those settings would persist on reboot.
LikeLike
By: rolande on January 31, 2015
at 11:56 am
I checked the values in Cocktail after reboot, they were altered, the values sticked.
LikeLike
By: joe on January 31, 2015
at 11:51 am
If that is the case, then Apple has changed the persistence of that command to survive reboot. You would need to manually run that command for each setting and set it back to the default value yourself.
LikeLike
By: rolande on January 31, 2015
at 11:58 am
okay, do you know where can I find the default values?
LikeLike
By: joe on January 31, 2015
at 12:03 pm
Not off hand. I am pretty sure I have a backup file but it is on my laptop and I am not on it at the moment.
LikeLike
By: rolande on January 31, 2015
at 1:28 pm
Joe, by merely deleting the file sysctl.conf will set everything back to default. This file I think doesn’t exist in the first place by default
Scott, any update on Yosemite settings? Is there something new that we could tweak?
Thanks
LikeLike
By: Mark on February 4, 2015
at 6:09 am
This really helped my corporate imaged system that is on Yosemite. Just created the file, copy/pasted and rebooted and wow, 2x network performance on just about everything.
As a long time Windows user I am really surprised how bad it was out of the box.
Anyway, thank you sir!
LikeLike
By: Matt H on January 30, 2016
at 12:25 am
Rwin on windows interpretation
I have a question regarding TCP receive window size.
Here is an example obtained by wireshark :
1-Client A :syn, win=8192 , ws=4 ; mss=1460====>
-data–
<==============4-Client B: Ack ; win 6912
1–How did we obtain 65700 (client A :from 8192 to 65700 ; and B from 5840 to 6912 ) in the three way handshake ?
or why the rwin increasing during the handshake(it is not the slow start) ?
2-And how does the ws get negotiated?
thank's in advance.
LikeLike
By: brahim on March 23, 2016
at 11:38 am
Will you be updating this for El Capitain? I think this version of OSX has removed the net.inet.tcp.rfc1323 setting.
LikeLike
By: Dave on June 13, 2016
at 10:10 pm
I’ve had no time to mess around with it and find the changes and research any impacts. Not sure when I’ll get time to mess with it. It is likely they have removed the option of disabling rfc1323 and it is just on by default now.
LikeLike
By: rolande on June 16, 2016
at 10:28 am
Funny enough, I can confirm the 10gbit performance issues.
I don’t understand them yet, not by a long shot.
Setting net.inet.tcp.delayed_ack: 1 -> 0 fixes i.e. some video playback on the LAN. I got one local webserver that loads nice and fast if I use my 1gbit Caldig docking station, and it’ll perform like shit when going over 10gbit thunderlink.
FTP on the other hand reads at 500MB/s if I’m lucky. Once it dropped through the floor to the kbit/s range, and I rebooted to “solve” that.
It seems the autotuning for this case is going all the wrong way.
And I suppose Atto’s and Apple’s settings collide.
LikeLike
By: darkfader on August 6, 2016
at 11:51 pm
Hi scott!
For fiber internet do you happen to know the best value for net.inet.tcp.mssdflt ?
How Are the parameters above affected by this type of connection?
LikeLike
By: Mark on May 11, 2017
at 1:05 pm
It depends on the provider. If the default MTU is 1500 like normal Ethernet delivery, then I would recommend net.inet.tcp.mssdflt be set to 1448. 40 Byte overhead on the normal TCP/IP header plus 12 additional Bytes for the RFC1323 window scaling feature now enabled by default which uses the optional TCP timestamps field.
LikeLike
By: rolande on October 1, 2017
at 11:53 am
Rolande
Do you have any plans for tips and tweaks on Windows 10?
LikeLike
By: Mark on August 12, 2018
at 9:33 pm
I haven’t used a Windows machine since 2012. If I had one, I would do the research and testing. But, without the need for it, I’m not planning to spend any time on it. However, I do need to spend some time to update for 10.13 High Sierra.
LikeLike
By: rolande on August 21, 2018
at 10:59 am
That’s Great! However, Mojave is coming really soon. Is it possible to do that as well?
LikeLike
By: Mark on August 22, 2018
at 6:10 pm
Hi Scott! Thanks for the great, detailed info. I’m trying to figure out how to do some AFP-specific tuning for WAN transfers involving 10.6.8 Servers and newer clients. I’ve tried some of the TCP tuning you suggested such as Window Scaling and send/recvspace, but these do not seem to affect the slow AFP transfers. Additionally, Software Update Service transfers via HTTP on the same 10.6.8 servers are able to max out the Internet connection just fine. Wondered if you might have a look at this MacRumors thread I started and see if anything came to mind:
https://forums.macrumors.com/threads/optimizing-afp-yes-afp-over-wan-lan.2152590/
Thanks,
Fred
LikeLike
By: Fred on November 15, 2018
at 1:34 am
Hi Rolande,
How much do these tuning settings apply when using jumbo frames (MTU 9000) and 10GbE ethernet?
LikeLike
By: Troy Williams on January 30, 2019
at 1:49 am
To be honest, I haven’t done the math for that scenario. Most critically, you need to calculate an appropriate window scaling factor and window size to ensure you can fill the pipe to get the most out of it. I assume that most of that data is going to stay on the local network fabric and using higher end hardware. So, latency is going to be low enough that most of the settings will have an arguably insignificant overall affect on throughout. If you are trying to maximize a longer distance 10 Gig pipe (>5msec latency) then these settings will certainly impact sustained throughput.
LikeLike
By: rolande on April 13, 2019
at 1:38 pm
[…] https://rolande.wordpress.com/2014/05/17/performance-tuning-the-network-stack-on-mac-os-x-part-2/ […]
LikeLike
By: Performance Tuning the Network Stack on macOS High Sierra 10.13 and Mojave 10.14 | Rolande's Ramblings on April 16, 2020
at 2:43 pm
Hello Rolende,
Just curious — your basic recommended settings (pasted below) are still applicable for MacOS Catalina 10.15.7? I do see some of these settings on my iMac 27 by default are matching your recommendations while others for example, somaxconn still defaults to 128.
kern.ipc.somaxconn=2048
net.inet.tcp.rfc1323=1
net.inet.tcp.win_scale_factor=4
net.inet.tcp.sendspace=1042560
net.inet.tcp.recvspace=1042560
net.inet.tcp.mssdflt=1448
net.inet.tcp.v6mssdflt=1412
net.inet.tcp.msl=15000
net.inet.tcp.always_keepalive=0
net.inet.tcp.delayed_ack=3
net.inet.tcp.slowstart_flightsize=20
net.inet.tcp.local_slowstart_flightsize=9
net.inet.tcp.blackhole=2
net.inet.udp.blackhole=1
net.inet.icmp.icmplim=50
Thanks.
LikeLike
By: Arul on October 31, 2020
at 10:33 am
See my updated post. Catalina’s settings are effectively the same as Mojave. https://rolande.wordpress.com/2020/04/16/performance-tuning-the-network-stack-on-macos-high-sierra-10-13-and-mojave-10-14/
LikeLiked by 1 person
By: rolande on November 1, 2020
at 11:01 am
Thanks!
LikeLike
By: Arul on November 1, 2020
at 11:47 am
[…] to Performance Tuning the Network Stack on Mac OS X Part 2, edit your /etc/sysctl.conf file as follows and reboot your […]
LikeLike
By: Adb transfers file with a very slow speed - iZZiSwift on December 4, 2020
at 2:03 pm
[…] to Performance Tuning the Network Stack on Mac OS X Part 2, edit your /etc/sysctl.conf file as follows and reboot your […]
LikeLike
By: Adb transfers file with a very slow speed - Tutorial Guruji on June 11, 2021
at 6:42 am